TAC Index | Global Air Freight Rate Market Data
Search
Close this search box.

Search

TAC Index air freight rate index from Europe to the United States from 2020

Track air freight prices from Europe to United States with TAC Index

TAC Index launches air freight rate data from Europe to the United States (US). You can now track outbound and inbound air cargo costs between Europe and the US with TAC Index data. This new route complements existing air cargo price coverage from Frankfurt (Germany), London (United Kingdom) and Milan (Italy) to the United States. The United States is the largest trading partner with Europe. In 2022, the EU exported 509 billion Euros in goods, and imported 359 billion Euros (source: Eurostat). This makes the US the largest export market, and second-largest import market, for Europe. Since 2017, numerous exogenous factors such as the Covid pandemic, geopolitical unrest, and volcanic eruptions have impacted air cargo prices from Europe to the US. In early 2020 air cargo costs increased by nearly 200% with price volatility remaining high until mid 2022. Since then air freight rates have declined globally and in mid 2023 returned to levels seen before the Covid pandemic. Use TAC Index for data-driven supply chain decisions and leverage its accurate, real-time insights into air cargo price dynamics to gain a competitive edge. You can track the latest air cargo market data at TAC Index.

Read More »
Vietnam to Europe air freight rate index

Air freight rates out of Vietnam driven up by Red Sea crisis and Lunar New Year demand

Air freight rates from Vietnam to Europe are on the rise. The combination of demand from the ocean freight disruptions and Lunar New Year is finally driving up prices. TAC Index data shows that, although air freight volumes increased in the two weeks to the 22nd January, the average achieved price per kg from Vietnam to Europe decreased (-20%). This trend has reversed with rates to Europe increasing 15.9% WoW to the 29th January. With the current ocean freight disruptions air cargo demand increased earlier this year relative to Lunar New Year. Air cargo volumes increased by 79% in the week to the 15th January, in line with the volume increase (75%) seen in the same period in 2023. This increase came a month, rather than 2 weeks, before Lunar New Year. We now enter the typical demand period with higher sustained volumes and increasing prices. If we look in more detail at the volume dynamics leading up to Lunar New Year we observe similarities and differences with previous years. The differences are likely caused by the ocean freight disruptions. Vietnam to Europe: air cargo volumes up earlier than usual In the lead up to Lunar New Year there is usually an increase in air cargo volumes from Vietnam to Europe. You can see this for the last three years in the chart above. Volumes increased 79% in the week to the 15th January this year, with a similar increase of 75% observed in the first two weeks of 2023. So this move is not atypical for this time of the year. There are two major differences relative to the preceding years. First, is in the timing relative to Lunar New Year. Usually volumes increase two weeks before the holidays, but this year the increase comes a full month beforehand (see chart above). Second, is in the size of the increase relative to peak season volumes. This year, volume increases are above peak season whereas in the previous two years the increase in volume remained below peak season highs. This early timing and relative size of the increase indicate that these changes are related to the ocean freight disruptions. You can track the impact on Vietnam to Europe air cargo prices at TAC Index.

Read More »
Change in air cargo prices from China to Europe and China to US since July 2023

No surge yet in air freight rates from North Asia due to Red Sea crisis

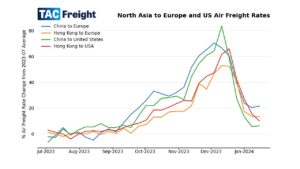
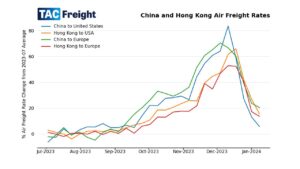
Data released by TAC Index on Monday 15th January showed that air cargo prices from North Asia to Europe had increased, but we have yet to see a ‘surge’ in rates from the current ocean freight disruptions.  Higher air freight rates from North Asia to Europe compared to the US, relative to pre-peak levels (average rate in July 2023), supported by the underlying price distribution dynamics, suggest higher and increasing air cargo demand, especially out of China. This is likely in reaction to the ocean freight disruptions combined with the upcoming Lunar New Year holidays when demand and rates tend to rise. The aggregate data does mask some more granular variations as rates on some lanes showed larger increases. For example, Shanghai and Hong Kong to Amsterdam, increased by +9.7% and +6.2% respectively in the week to 15th January. China to Europe and the United States Air freight rates out of China to both Europe and the US saw a slight increase in the week to 15th January. Average air cargo prices from China to Europe increased by +1.3% week on week (WoW), and prices from China to the United States halted their decline with a +0.8% WoW increase. There are significant differences in the current prices compared to their pre-peak average for the two markets (see chart above). From China to Europe air freight rates were 21.6% above their pre-peak average compared to only 6.4% to the US. This suggests that relative demand, in respect to pre-peak levels, is higher to Europe than to the US. Although average rates for both China-Europe and China-US increased slightly last week there were differences in the underlying dynamics of the price distribution observable in the inter-quintile (20th to 80th percentile) ranges (see charts above). From China-US the upper-quintile was stable, but the lower quintile was still declining. Whereas from China-Europe the lower-quintile was stable and the upper-quintile increasing. These price dynamics suggest that air cargo demand to Europe is increasing. Hong Kong to Europe and the United States In the week to the 15th of January air freight rates out of Hong Kong to Europe stabilised with a -0.2% WoW decrease, whereas from Hong Kong to the United States rates continued to decline with -4.6% WoW decrease.  In contrast to China, there are no significant differences in the current prices compared to their pre-peak average for the two markets (see chart above). Average prices to Europe indicate the market has stabilised 13% above pre-peak levels whereas to the US they were now only 10% above and still decreasing. Comparing the air cargo price time series for the two markets (plotted above), there were differences in the underlying dynamics of the price distributions. From Hong Kong-Europe, across the full range, prices have been stable WoW. This is in contrast to Hong Kong-US where they have all been decreasing.  You can keep up to date with all air cargo price developments at TAC Index.

Read More »
Europe to China air freight rate index from 2020

TAC Index Launches Air Freight Rates from Europe to China

TAC Index is pleased to announce that air freight rates for general cargo from Europe to China are now available on the TAC Index website. This route complements our more granular air cargo market coverage to China, such as Frankfurt to China and Frankfurt to Shanghai. China is the second largest export market from Europe (excluding intra-Europe trade). The EU alone exported more than 230 billion Euros of goods to China in 2022 (source: Eurostat). The EU also imported more than 620 billion Euros worth of goods from China in 2022 making it the EU’s largest import partner (source: Eurostat). With TAC Index data you can now track air cargo price volatility on both Europe to China export and China to Europe import markets. Air freight rates from Europe to China currently sit below pre-Covid levels, but they have had a turbulent journey since the start of 2020. Air cargo prices surged more than 200% with the initial impact of Covid in 2020 and then again with further lockdowns in September 2021. Then in 2022, as rates were declining, air cargo capacity was rocked by Russia’s invasion of Ukraine sending rates to their peak in mid 2022. Since then, and with the reopening of China in early 2023, air freight rates have been on a consistent downward trend before stabilising in Q2 2023. Use TAC Index to make data-driven supply chain decisions and gain an edge with accurate, real-time insights into air cargo price dynamics. You can now track the latest air freight rate market data through the TAC Index dashboard.

Read More »

Air Freight Rates from China and Hong Kong to United States and Europe Revert from December Peak

Air cargo costs out of China and Hong Kong to the United States and Europe have quickly returned to levels last seen in September after surging on e-commerce demand through the 2023 peak season. The welcomed return of the peak season provided some positivity to the air freight market following a lackluster couple of years. The only upturn in rates in 2022 was due to the invasion of Ukraine that caused capacity disruptions from the closure of Russian air space and the loss of Russian airlines, such as AirBridgeCargo, which were significant capacity providers. Since then it has been a constant downward trend until the first green shoots emerged in September. New geopolitical events in the Middle East, with the ongoing Red Sea crisis, means ocean freight is now being diverted around Africa. This increases both the cost and transit times for ocean shipments. With the reduction in air cargo prices in the new year the cost differential between ocean and air freight has narrowed, making air freight a more attractive option in the run-up to the Lunar New Year in February. Freight Forwarders are also getting an increase in enquiries for multi-modal sea air solutions via Dubai, Singapore, and Los Angeles. This could provide a good compromise between the speed of air freight and the cost of sea freight. We have yet to see a significant impact from the ocean freight disruptions on North Asia air freight rates. However, out of China air cargo prices to Europe have dropped less, and more slowly, from their peak range compared to the US. This difference in rate reversion could be indicative of the relatively higher impact from the Red Sea crisis on Asia to Europe shipping than to the US. Christmas and New Year are a quiet period for air freight, so we will only see the full impact on air cargo costs as we approach the Lunar New Year holidays. The impact on air freight costs differ regionally as this peak reversion is less evident from other South East, and South Asian countries. Viet Nam also saw a peak surge, rising more than 80% from their July averages, at the end of 2023 and these high rates out of Viet Nam to Europe and the United States persist into the new year. Track the latest air cargo price movements at TAC Index.

Read More »

TAC Index Launches Air Freight Rate Index from Europe to Japan

TAC Index is pleased to announce that an air freight rate index for general cargo from Europe to Japan is now available on the TAC Index website. Japan is one of the largest export markets from Europe, with the EU exporting more than 70 billion Euros of goods to Japan in 2022. The TAC Index data now empowers participants in this trade lane with real-time insights into air freight rates, aiding strategic decision-making in this dynamic market. Air freight rates from Europe to Japan have been particularly impacted by exogenous risk factors and this is reflected in the volatility of the air cargo prices over the past 4 years. In 2020 rates tripled due to the impact of Covid. Then in 2022 rates were impacted again by Russia’s invasion of Ukraine. This led to air freight costs doubling due to the closure of Russian air space causing flights to be rerouted or cancelled, significantly reducing available capacity. While air freight rates from Europe to Japan have declined significantly from the peak in 2022, they still sit comfortably above the pre-Covid levels. You can now track the latest market data through the TAC Index dashboard.

Read More »

TAC Index Launches Air Freight Rate Index from Bangkok (Thailand) to Europe

TAC Index is pleased to announce that an air freight rate index for general cargo from Bangkok (Thailand) to Europe is now available on the TAC Index website. Thailand has a large export market to Europe, with the EU importing more than 27 billion Euros of goods from Thailand in 2022. The TAC Index data provides participants in this trade lane with real-time insights into air freight rates, aiding strategic decision-making in this dynamic market. Air cargo costs from Bangkok to Europe have had a turbulent journey in the last 4 years, soaring by over 300% from pre-Covid to its peak in 2022 before returning to 2019 levels earlier this year. Now, you can stay on top of these market dynamics with up to date data from TAC Index. You can now track the latest market data through the TAC Index dashboard.

Read More »