TAC Index | Global Air Freight Rate Market Data
Search
Close this search box.

Search

After gyrations in February, air freight rates end the month lower

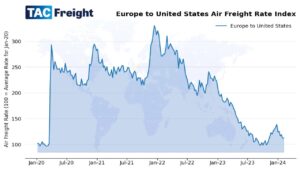
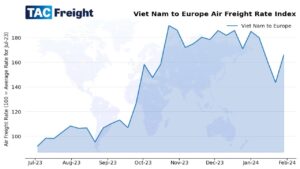
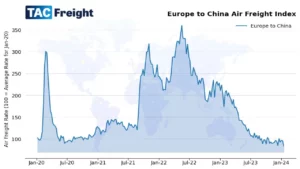
February was a strange month in air cargo markets, with a range of conflicting factors driving market rates wildly up and down at different points over the period. Among the key factors were notably the continuing disruption to ocean shipping traffic in the Red Sea – and the big surge in shipping rates that had sparked late last year. There were also instances of congestion leading to the suspension of air cargo business for short periods in certain locations, notably in Dubai and then in Bangkok – though these did not seem to be related directly to events in the Red Sea. Plus the usual rush of business ahead of the Chinese New Year holiday – which often leads to an observable ‘mini-peak’ in air freight rates in the two to three weeks ahead of that. There was indeed a rise in rates in the period ahead of Chinese New Year, but when the holiday arrived there was also then the usual big fall in volumes – and rates – out of China. After various ups and downs the overall Baltic Air Freight Index (BAI00) ended the four weeks to 4 March lower by -8.7%, leaving it at -25.0% over 12 months, reflecting a market that despite growth in some areas such as e-commerce, remains relatively soft overall. After a rebound in rates in the final week of the month, the index of outbound routes from Hong Kong (BAI30) – still the busiest airport in the world for air cargo – was lower by some -12.0% MoM, leaving it at -13.9% YoY. Despite a similar rebound following Chinese New Year, outbound Shanghai (BAI80) was also lower by -15.1% MoM leaving it at -9.9% over 12 months. Elsewhere out of Asia, however, there were some pretty big moves on other lanes – notably out of India. Rates from India started to surge in mid-February both to Europe and to North America and have kept going up – suggesting that more shippers from there are indeed turning to air cargo to beat the problems with ocean transport in the Red Sea. In other regions, however, the market was quieter. From Europe, the index of outbound routes from Frankfurt (BAI20) edged up by +1.8% MoM, though leaving it still a long way lower YoY at -45.5% reflecting what has continued to be a sluggish economy in Europe. Outbound London Heathrow (BAI40) was also close to flat at -3.0% MoM, leaving it at -48.3% YoY. From the Americas, outbound Chicago (BAI50) was an exception – higher by +9.8% MoM, though still lower by some -35.0% YoY. Debate about the global macro outlook continued to focus heavily on interest rates and prospects for rate cuts – starting in the US and then Europe – and how that might stimulate a revival in economic growth.  Markets appeared to be gearing up for rate cuts ahead – despite guidance from Federal Reserve chairman Jerome Powell and other central bank governors that they plan to proceed with caution. And despite the ongoing geopolitical crises in Ukraine and the Middle East, energy price levels – including for jet fuel – remained subdued. Indeed, crude oil prices were flat to down over the month, and the ‘crack spread’ between crude and jet fuel prices also tightened by some 16.8% in the month to 1 March according to Platt’s data, making jet fuel considerably cheaper for carriers. Equity market activity continued to be dominated by the top few US tech stocks, but with some now citing a ‘Magnificent 5’ of Amazon, Alphabet / Google, Meta, Microsoft and Nvidia – no longer a ‘Magnificent 7’ – with Apple and Tesla falling back, partly as they seem to have fewer short to medium term opportunities in artificial intelligence (AI). In Tesla’s case, some investors have argued for a long time that it was hugely overvalued – given continued consumer preferences for hybrid cars rather than electric vehicles (EVs).  That has turned out to be more good news so far this year for markets in Japan – given that Toyota is the market leader in hybrids followed by Honda and Hyundai of South Korea. All those stocks have enjoyed a surge since the start of 2024, with the Nikkei 225 index storming ahead by close to 20%. In China, by contrast, the market has struggled – with investors still underwhelmed by official efforts to stimulate stronger economic growth and address problems with the housing sector and youth unemployment. That said, China continues to be by some distance the most important exporter in world markets – including in fast growing sectors like e-commerce. In Europe, too, markets remained somewhat in the doldrums – with the war in Ukraine and higher gas and power prices continuing to cast a shadow.  That said, there are some bright spots in Europe too – including stocks like Novo Nordisk in Denmark, which has got investors very excited with its GLP-1 weight loss drugs which appear to offer a highly effective treatment to the global problem with obesity. They seem to be very much the sort of high value products that can and will be transported by air cargo. Another notable development over the month was a surge in cryptocurrencies led by Bitcoin and Ethereum amid renewed optimism about the potential applications and use cases for blockchain technology – something else that would seem to have potential in air cargo markets.

Read More »
TAC Index air freight rate index from Europe to the United States from 2020

Track air freight prices from Europe to United States with TAC Index

TAC Index launches air freight rate data from Europe to the United States (US). You can now track outbound and inbound air cargo costs between Europe and the US with TAC Index data. This new route complements existing air cargo price coverage from Frankfurt (Germany), London (United Kingdom) and Milan (Italy) to the United States. The United States is the largest trading partner with Europe. In 2022, the EU exported 509 billion Euros in goods, and imported 359 billion Euros (source: Eurostat). This makes the US the largest export market, and second-largest import market, for Europe. Since 2017, numerous exogenous factors such as the Covid pandemic, geopolitical unrest, and volcanic eruptions have impacted air cargo prices from Europe to the US. In early 2020 air cargo costs increased by nearly 200% with price volatility remaining high until mid 2022. Since then air freight rates have declined globally and in mid 2023 returned to levels seen before the Covid pandemic. Use TAC Index for data-driven supply chain decisions and leverage its accurate, real-time insights into air cargo price dynamics to gain a competitive edge. You can track the latest air cargo market data at TAC Index.

Read More »
Vietnam to Europe air freight rate index

Air freight rates out of Vietnam driven up by Red Sea crisis and Lunar New Year demand

Air freight rates from Vietnam to Europe are on the rise. The combination of demand from the ocean freight disruptions and Lunar New Year is finally driving up prices. TAC Index data shows that, although air freight volumes increased in the two weeks to the 22nd January, the average achieved price per kg from Vietnam to Europe decreased (-20%). This trend has reversed with rates to Europe increasing 15.9% WoW to the 29th January. With the current ocean freight disruptions air cargo demand increased earlier this year relative to Lunar New Year. Air cargo volumes increased by 79% in the week to the 15th January, in line with the volume increase (75%) seen in the same period in 2023. This increase came a month, rather than 2 weeks, before Lunar New Year. We now enter the typical demand period with higher sustained volumes and increasing prices. If we look in more detail at the volume dynamics leading up to Lunar New Year we observe similarities and differences with previous years. The differences are likely caused by the ocean freight disruptions. Vietnam to Europe: air cargo volumes up earlier than usual In the lead up to Lunar New Year there is usually an increase in air cargo volumes from Vietnam to Europe. You can see this for the last three years in the chart above. Volumes increased 79% in the week to the 15th January this year, with a similar increase of 75% observed in the first two weeks of 2023. So this move is not atypical for this time of the year. There are two major differences relative to the preceding years. First, is in the timing relative to Lunar New Year. Usually volumes increase two weeks before the holidays, but this year the increase comes a full month beforehand (see chart above). Second, is in the size of the increase relative to peak season volumes. This year, volume increases are above peak season whereas in the previous two years the increase in volume remained below peak season highs. This early timing and relative size of the increase indicate that these changes are related to the ocean freight disruptions. You can track the impact on Vietnam to Europe air cargo prices at TAC Index.

Read More »
Europe to China air freight rate index from 2020

TAC Index Launches Air Freight Rates from Europe to China

TAC Index is pleased to announce that air freight rates for general cargo from Europe to China are now available on the TAC Index website. This route complements our more granular air cargo market coverage to China, such as Frankfurt to China and Frankfurt to Shanghai. China is the second largest export market from Europe (excluding intra-Europe trade). The EU alone exported more than 230 billion Euros of goods to China in 2022 (source: Eurostat). The EU also imported more than 620 billion Euros worth of goods from China in 2022 making it the EU’s largest import partner (source: Eurostat). With TAC Index data you can now track air cargo price volatility on both Europe to China export and China to Europe import markets. Air freight rates from Europe to China currently sit below pre-Covid levels, but they have had a turbulent journey since the start of 2020. Air cargo prices surged more than 200% with the initial impact of Covid in 2020 and then again with further lockdowns in September 2021. Then in 2022, as rates were declining, air cargo capacity was rocked by Russia’s invasion of Ukraine sending rates to their peak in mid 2022. Since then, and with the reopening of China in early 2023, air freight rates have been on a consistent downward trend before stabilising in Q2 2023. Use TAC Index to make data-driven supply chain decisions and gain an edge with accurate, real-time insights into air cargo price dynamics. You can now track the latest air freight rate market data through the TAC Index dashboard.

Read More »